Neu: PatchFlux AI™ für präzise Zellanalysen unter kontrollierten Flussbedingungen

Neu: PatchFlux AI™ für präzise Zellanalysen unter kontrollierten Flussbedingungen

Cell culture applications using the PatchFlux AI flow cytometer

In einem Verbundprojekt wurde das PatchFlux AI entwickelt. Ein mikrofluidisches System, das speziell dafür entwickelt wurde, Zellen unter definierten Flussbedingungen präzise zu untersuchen. Forschende können Scherspannung, Temperatur, pH-Wert und Medienwechsel exakt steuern und so physiologische oder pathologische Bedingungen realitätsnah nachbilden.

Thanks to the integrated high-precision thermostat, the temperature remains stable even during long-term experiments. Shear profiles, exposure duration, and media exchange can all be set via software control and reproduced consistently. This makes PatchFlux AI especially suitable for studies on:


      • Erythrocyte deformability and membrane mechanics

      • Osmotic fragility

      • Cell adhesion under flow

      • RBC shape analysis and aggregation

      • Patch-clamp under controlled flow conditions

      • Pharmacological responses, dose-response relationships, and reversibility


    Zuletzt hat die Fachhochschule Aachen zusammen mit HITEC ZANG einige Experimente zur Quantifizierung osmotischer Fragilität bei roten Blutkörperchen durchgeführt.

    Das Team untersuchte, wie Aquaporine (AQP) die osmotische Fragilität roter Blutkörperchen beeinflussen. Mithilfe des PatchFlux AI  verglichen sie zwei Modulatoren (HgCl₂ und LPS) und stellten ihren neuen durchflussbasierten Ansatz der klassischen Methode zur Messung der osmotischen Fragilität gegenüber. Die Ergebnisse sprechen für sich: PatchFlux AI liefert präzise, robuste Messungen und bietet durch seine proprietäre, KI-gestützte Suite zur Analyse und Überwachung der Erythrozytenform zusätzliche Einblicke.


    Paper Diagramm | HITEC ZANG – Führender Anbieter für Laborreaktoren in der chemischen Verfahrenstechnik


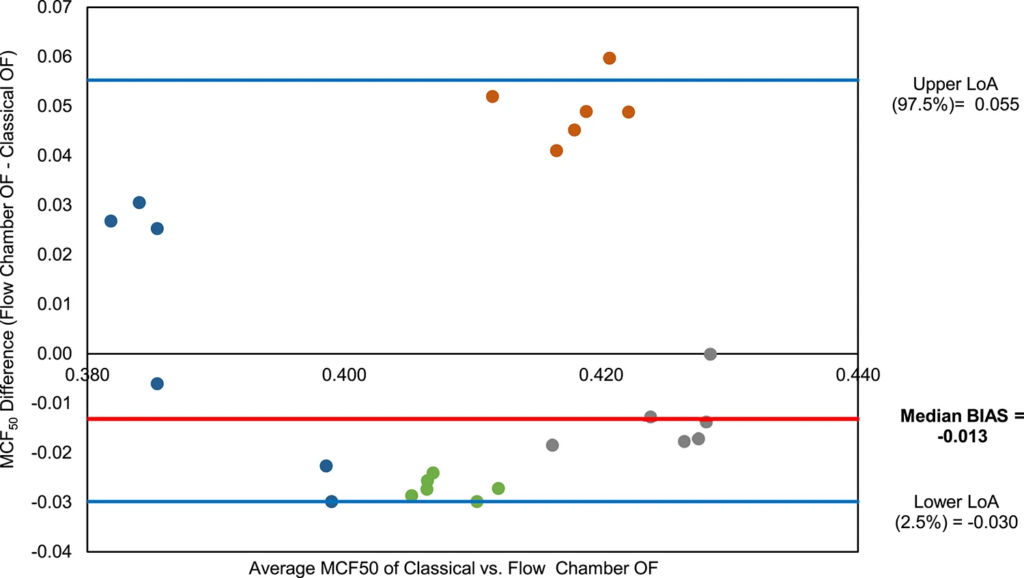
    Non-parametric Bland–Altman plot comparing MCF₅₀ values obtained from the flow chamber and classical osmotic fragility methods. Points represent individual paired measurements (4 donors × 6 occasions) and are color-coded by donor. The y-axis represents the difference in MCF₅₀ values (Flow Chamber—Classical), while the x-axis shows the average of the two methods. The solid red line indicates the median bias (− 0.013), and the blue lines represent the 2.5th and 97.5th percentiles of the differences (− 0.055 and 0.030, respectively), serving as non-parametric limits of agreement.)

    From Research

    A novel AI-coupled flow chamber method quantifying erythrocyte osmotic fragility

    IPEK SEDA Firat, Özgür Alacayir, Till Kreutz et al. • Scientific Reports 16 • 2026

    DOI: 10.1038/s41598-026-38322-z

    The form has been successfully submitted.

    Thank you very much! We have received your data and will usually contact you personally within the next three working days – regardless of whether it concerns a specific project, a quote, or an initial consultation.